As an example; we noticed a lot of back and forth (what we call "ping-pong") on the tickets as users created one, explaining their issue but not giving us any information that would allow us to test this ourselves or to try to reproduce it. So, our first reply is one asking for more information, they provide more information, we check again, find something else missing, ask for more information, which they provide. In the end a lot of time and momentum goes to waste waiting for the right deliverables to be provided.
To address this, one of the things we implemented was a guideline for our users in which we shared what we expected from them. If they wanted their ticket to move faster, these were the things we asked them to provide from the get-go.
We linked this guideline to a ticket template they could use to create their ticket. More on ticket templates later ;)
The basics - how to not make the IT support team hate you
To be honest, this is the bare minimum. If you don't provide at least this, you shouldn't be surprised with a response like "Have you tried turning it off and on again?".
- environment urls + credentials
- on which environment did the issue occur? did you try it on other environments? which credentials are necessary to access this environment?
- devices impacted (browser, type of device, operating system, etc.)
- steps to reproduce the issue
- screenshots (more info below)
- impact: who is affected and how
The goodies - how to make the IT support team love you
Depending on the issue, deliverables such as screenshots, screen recordings, console exports, HAR exports etc. can be very useful to help the support team investigate the issue. Below I've listed some of the deliverables, how to create or generate them.
Screenshots
Please make screenshots of the page where the issue is shown, please make sure the browsers address bar is shown in the screenshot to keep a reference of where the issue appears. If needed, you can make drawings on the screenshots to clarify what is going wrong. You can use simple drawing tools for this (like Paint) or use software such as SnagIt (requires a license) which will allow you to draw, highlight etc.
Screen recordings
Screen recordings have the benefit of showing the reproduction steps and are therefore super useful.
Please start a recording and walk through the issue step by step so the team can see the flow and the issue as it pops up. You can create recordings with software such as Camtasia (requires a license) but if you don't have this you can also manage this by opening a Zoom or Teams call (or any meeting software you use at your company) on your own and make a recording as you share the screen and walk through the issue (you don't have to narrate). You can then share the recording link in the ticket you created for the issue.
Console log export
Although more advanced, the browser console is one of the most useful deliverables for the support team along with the HAR file.
For Google Chrome
- Press F12 on your keyboard to open the Developer Tools, a bar will show up at the bottom of side of your screen.
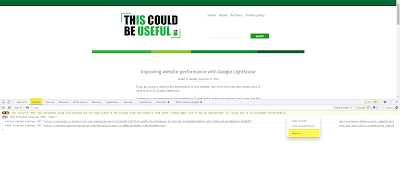
- Make sure the "Console" tab is opened and refresh the page to make sure all errors are recorded in the Console as you follow the steps to reproduce the issue.
- Right-click in the console and click "Save as..." to create a ".log" file, please also take some screenshots (specifically of the logs listed as errors/in red) as the log will not contain all the details.
For Safari
- Click "Develop" in the menu and click "Show Web Inspector" (Or Press Cmd + Alt + i), a bar will show up at the bottom of side of your screen.
- If you don't have this option available:
- Go to Safari > Preferences > Advanced > Enable "Show Develop menu in menu bar"
- Make sure the "Console" tab is opened and refresh the page to make sure all errors are recorded in the Console as you follow the steps to reproduce the issue.
- Select the entries in the log that you are interested in, right click on those entries and click "Save Selected" to create a ".txt" file, please also take some screenshots (specifically of the logs listed as errors/in red) as the log will not contain all the details.
HAR export
The HAR export is an export of a session of Network monitoring where we review which resources are loaded as part of the website.
For Google Chrome
- Press F12 on your keyboard to open the Developer Tools, a bar will show up at the bottom of side of your screen.
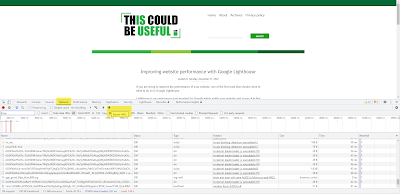
- Make sure the "Network" tab is opened and that the "red" recording button is enabled. Refresh the page to start recording the session as you follow the steps to reproduce the issue.
- When the page is fully loaded and the issue occurred, click the "Export HAR" icon (upward facing arrow icon) to create a ".har" file.
For Safari
- Click "Develop" in the menu and click "Show Web Inspector" (Or Press Cmd + Alt + i), a bar will show up at the bottom of side of your screen.
- If you don't have this option available:
- Go to Safari > Preferences > Advanced > Enable "Show Develop menu in menu bar"
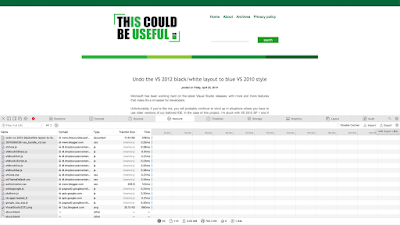
- Make sure the "Network" tab is opened. Refresh the page to start recording the session as you follow the steps to reproduce the issue.
- When the page is fully loaded and the issue occurred, click the "Export" icon (share icon) to create a ".har" file.
Add these useful deliverables to your support ticket and you'll be amazed at how fast your ticket will be resolved as you help avoid unnecessary ping-pong and set the support team up to test and reproduce the issue.
Could be useful, right?


No comments:
Post a Comment